- tags
- Machine learning
- paper
- (Van der Maaten, Hinton 2008)
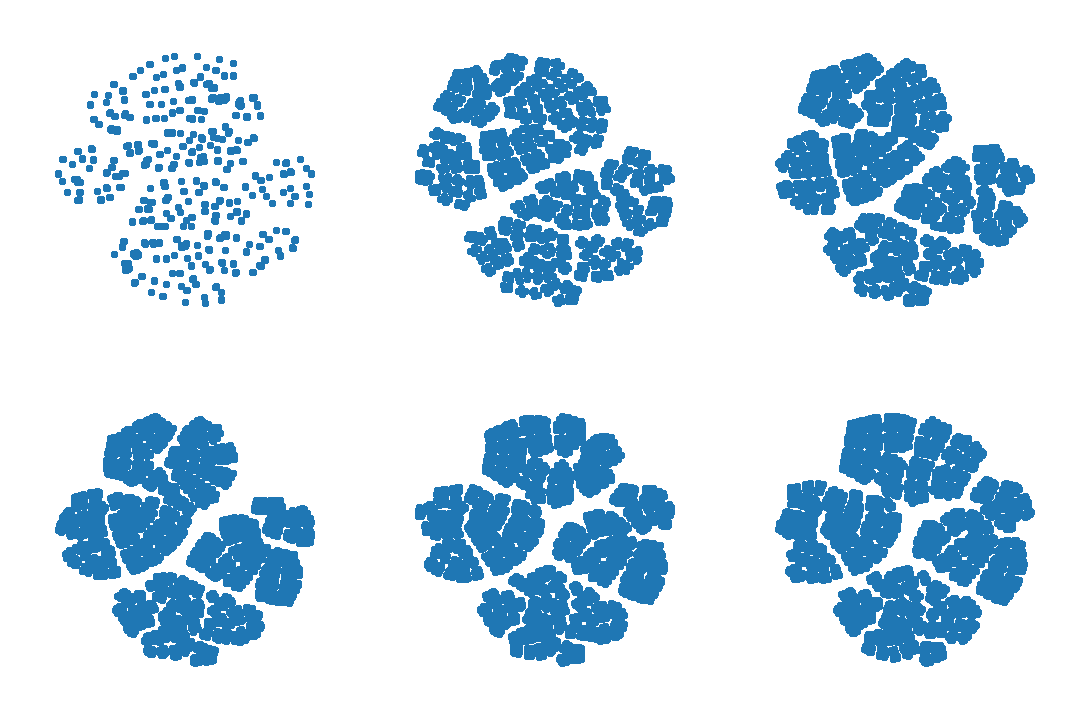
Example: Embedding the vertices of a high dimensional cube in 2D
We first create a cube with dimension 12:
import imageio
import numpy as np
import matplotlib.pyplot as plt
from sklearn.manifold import TSNE

# This creates a numpy array with the vertices of a N-dimensional cube.
# From https://stackoverflow.com/a/52229558
cube = lambda N: 2*((np.arange(2**N)[:,None] & (1 << np.arange(N))) > 0) - 1

# Create a 12-hypercube's vertices
cube_arr = cube(12)
steps = []
# We run t-SNE with 250 to 5000 iterations.
for d in np.linspace(250, 3000, 30):
    tsne = TSNE(init="pca", learning_rate=25, n_iter=int(d), random_state=143)
    steps.append(tsne.fit_transform(cube_arr))
Then, we save the successive outputs embeddings of the vertices for increasing number of iterations in a GIF file.
filenames = []
for n, c in enumerate(steps[1:]):
    plt.figure(figsize=(5, 5))
    plt.scatter(*c.T)
    plt.axis("off")
    fname = f"image{n}.png"
    plt.savefig(fname)
    filenames.append(fname)
with imageio.get_writer('tsne_movie.gif', mode='I',  duration=0.1) as writer:
    for filename in filenames:
        image = imageio.imread(filename)
        writer.append_data(image)

Bibliography
- Laurens Van der Maaten, Geoffrey Hinton. . "Visualizing Data Using T-sne.". Journal of Machine Learning Research 9 (11).